In Defense of... Bo Bichette? (Pt. 1)
Joining the war on batting averages on the side of batting averages.


There's really quite a lot to like about Bo Bichette. This is self-evident from his market value and his above-average career offense, but he's actually much better than his upfront stats suggest. A lot of Twitter GMs would have you believe otherwise, which is why I'm here to put an end to that nonsense and break down exactly what makes Bo Bichette not just good, but good for the Mets.
This has actually been in my drafts for a week and a half two weeks a while, during which time we've made quite a number of other roster moves and major sports media has slowly worked its way to some of the conclusions I've been sitting on. As such, I've cut down how much I originally planned to talk about the shape of the broader roster and how he fits into it. If you read anything in this piece that sounds like something you heard somewhere else, please know that I was on it first and just dragged my feet on publishing it. (Unlike journalists who have to cover other things, I have pretty much all day to trawl Baseball Reference and FanGraphs and Savant. Also unlike them, I don't have deadlines to meet and it's not my full-time job.)
This won't be a complete deep dive into literally every aspect of his player profile, because I could write 30,000 words on it and still not be done; I've chosen instead to focus on what I consider the most important aspects that have received less attention or been misconstrued in the broader conversation around him. I'll break down some acronyms and concepts as I go for those of you who aren't stat geeks, and if I've overlooked anything vital in my analysis, I look forward to hearing from those of you who are.
(If you're reading this as an email, I strongly recommend opening it in your desktop browser before proceeding further! There's a lot of tables to look at, and the email will likely get cut off towards the end.)
The Problem
At the time they announced Bo's deal, the Mets roster had some pretty glaring problems:
- Literally two outfielders, and as much as I love Tyrone Taylor, I don't think he can play both left field and center at once;
- A shaky pitching rotation at best, principally relying on rookies with barely any major league experience;
- Still a pretty ramshackle bullpen, outside of a couple solid late-game relievers;
- An excess of (young and controllable) infielders that desperately needed to be moved.
We also spent the 2025 season with too many power hitters—or players trying to be power hitters—and not enough contact to make that power effective for most of the lineup. One of our other main issues was spending way, way too long figuring out our fielding situation by shuffling rookies around and picking up new people who were, well, not good.
Obviously, many of the roster holes have been addressed to some extent with the additions of Luis Robert Jr., Freddy Peralta, Tobias Myers, and Luis García, as well as trading Jett Williams and Luisangel Acuña (which I'm still quite sad about). At first glance, picking up Bo would only serve to exacerbate some of those problems—he's an infielder who will ostensibly play full-time, and he's an awful shortstop, to put it plainly—but it's not actually as dire as it would appear. So what does he do for this team?
You've already heard the most important part: he's a really good hitter. On top of of being good overall, his hitting profile is a solid departure from having nine guys all trying to swing for the fences and missing badly; in particular, he's pretty damn great at simply hitting the ball, which, as you'll see, is quite useful when you have men on base.
He's also a right-handed hitter (as is Luis Robert Jr.), and we're pretty stacked with lefties right now. Juan Soto, Marcus Semien, and Brett Baty all bat left-handed, as will Carson Benge if he makes his debut; Jorge Polanco is a switch hitter, but his platoon splits will show you he performs best as a lefty; and while Mark Vientos, Francisco Álvarez, Luis Torrens, and Tyrone Taylor are all righties, they haven't provided reliable offense. Furthermore, adding another qualified infielder (relax, he's not playing shortstop) allows us to scoot people around a little bit and reduce some of our other needs—the idea floating around of playing Baty in left field is one such example—as well as giving us more freedom to deal from our glut of expendable extras.
There's only one real way to back up my argument, so it's time to wade bravely into the numbers and find out what exactly makes Bo Bichette so exciting!
The Bat
Okay, I am actually going to talk about things besides his batting average here. One thing you've probably heard about Bo is that he's one of the best hitters in baseball with runners in scoring position (RISP), and that's true! This is one reason why he's an excellent addition to our offense, but it's far from the only thing that makes him an outstanding hitter.
Bo by the Numbers
Let's take a basic look at Bo's career to get a sense for his overall hitting profile:
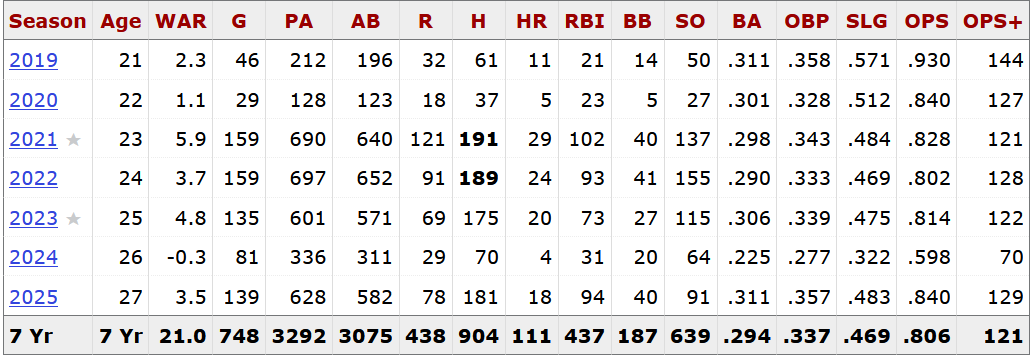
(Quick reminder: BA = batting average, OBP = on-base percentage, SLG = slugging percentage, OPS = on-base plus slugging, and OPS+ measures OPS relative to the rest of the league and adjusted to the player's ballpark.)
That's a lot of numbers, so let me sum up what I think the most important takeaways are:
- Bo is a strong overall hitter with a career OPS+ of 121, and one of his best assets is his high batting average (.294 career).
- He gets a lot of hits, but actually doesn't walk much (which can be estimated by subtracting BA from OBP, but we'll look at his actual walk rate later).
- There are four relatively normal seasons here, in terms of games played and plate appearances, and three outliers: 2019 (rookie season), 2020 (an outlier for all players due to the shortened season length), and 2024 (when he had serious injury problems). In particular, 2024 skews his numbers downwards and doesn't reflect his regular profile.
We can also look at his Statcast-based percentile rankings to get a sense of where he falls on a few key metrics relative to the rest of MLB:
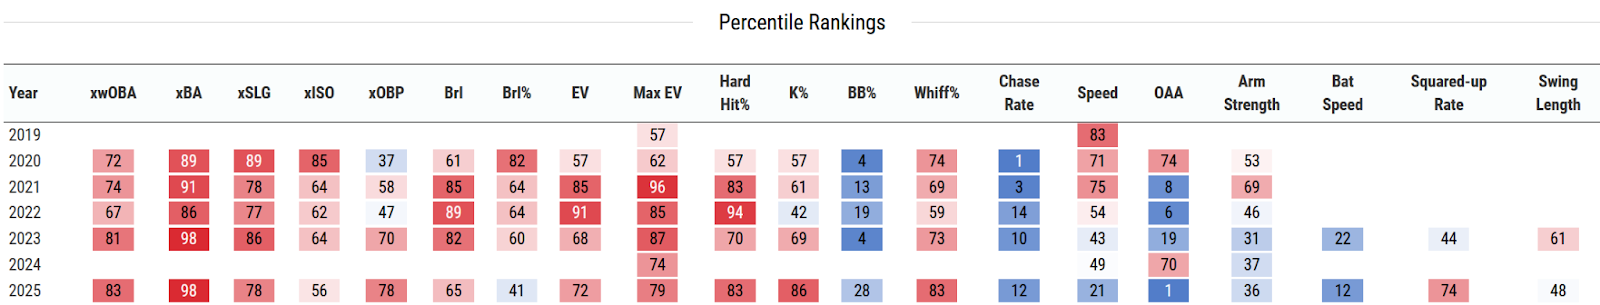
We'll return to the fielding side of things a bit later, but I want to use this to illustrate that Bo generally ranks well in exit velocity, hard hit rate, strikeout rate, and whiff rate (meaning he has a low strikeout/whiff rate). He hits the ball hard and he doesn't miss much when he swings, and it's important to note that those underlying factors have been present throughout his career and not just in 2025.
Similarly, you can see that his xwOBA has typically ranked well above average, especially in more recent years. For those unfamiliar with wOBA (weighted on-base average) and xwOBA, they're some of the best statistics out there for evaluating offensive contribution, and yet you will never see them mentioned in normal conversations. Why? My best guess is because, unlike OPS, the math is complicated and can't be done without information beyond a player's stats; still, they're worth learning about if you really want to know ball. Before I get too off-topic, here are the definitions, per MLB:
wOBA is a version of on-base percentage that accounts for how a player reached base -- instead of simply considering whether a player reached base. The value for each method of reaching base is determined by how much that event is worth in relation to projected runs scored (example: a double is worth more than a single).
Expected Weighted On-base Average (xwOBA) is formulated using exit velocity, launch angle and, on certain types of batted balls, Sprint Speed ... xwOBA is more indicative of a player's skill than regular wOBA, as xwOBA removes defense from the equation.
Because wOBA is based on weights that change over time, it's not as straightforward to calculate as a career statistic, but we can at least look year-by-year at what Bo's been up to. League-average wOBA in 2025 was .313. Bo's wOBA was .361, which is pretty darn good in comparison! It's stayed relatively stable within the realm of normal random variation during his "regular" seasons: .354 in 2021, .347 in 2022, and .349 in 2023. His career wOBA is .346, which is already nothing to sneeze at, but you also have to remember that it's dragged down slightly by his 2024 season, where it was an abysmal .264.
All of this is to say: he's very good.
There are a few key components of his offense I want to examine in closer detail: his batted ball profile, swing decisions, and splits (specifically by pitcher handedness, bases-occupied status, and lineup position). As I do, I'll primarily be looking at data from his four seasons with at least 600 PA (i.e. 2021–23 and 2025), because any trends from his first two seasons and 2024 are less likely to accurately reflect his hitting profile; however, data from those years is usually still included in career averages.
First up, his overall batted ball profile:
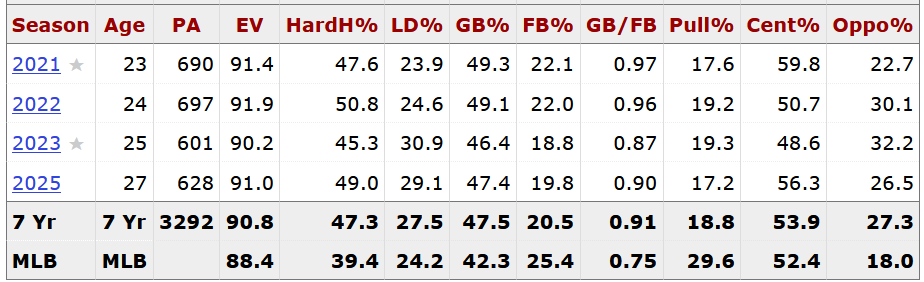
Career batted ball statistics and overall ratio batting from Baseball Reference.
The EV and HardH% columns help emphasize what his Statcast profile suggests: he smokes the hell out of the ball much better than the average player. He doesn't hit a ton of fly balls, which probably contributes to his relatively low home run rate, but he does hit a lot of ground balls. He also tends to go oppo much more and pull the ball much less than average—if you, like me, never remember which direction is which, here's MLB's official definition:
A "pull" attack direction means the barrel of the bat is moving toward left field for a right-handed hitter or right field for a left-handed hitter. An "oppo" attack direction means the barrel of the bat is moving toward right field for a right-handed hitter or left field for a left-handed hitter.
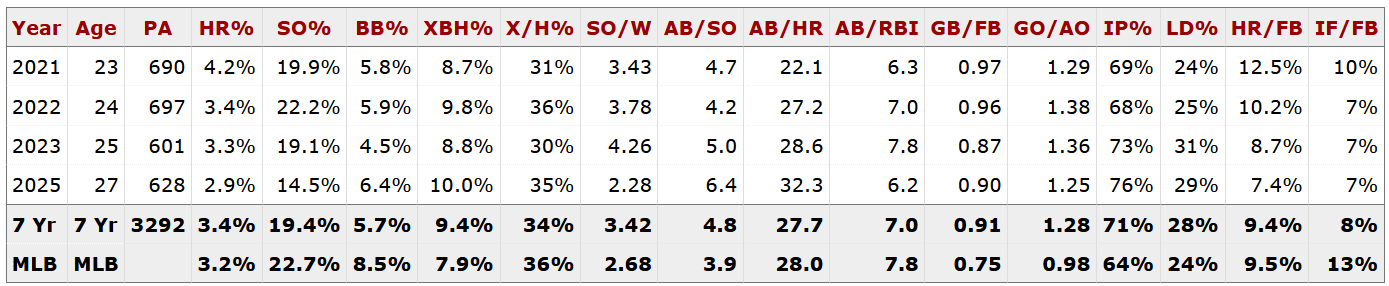
The most interesting parts of his ratio batting to me are his strikeout (SO%) and walk (BB%); these really help us put some more concrete numbers to those Statcast rankings.
- While his lowest home run rate came in 2025, he also hit a career-low SO%, and he strikes out way less than the average hitter.
- As mentioned previously, he doesn't walk much, although this has also improved a little over time.
Next up, his general swing decisions and situational batting statistics (with increasingly opaque column abbreviations):
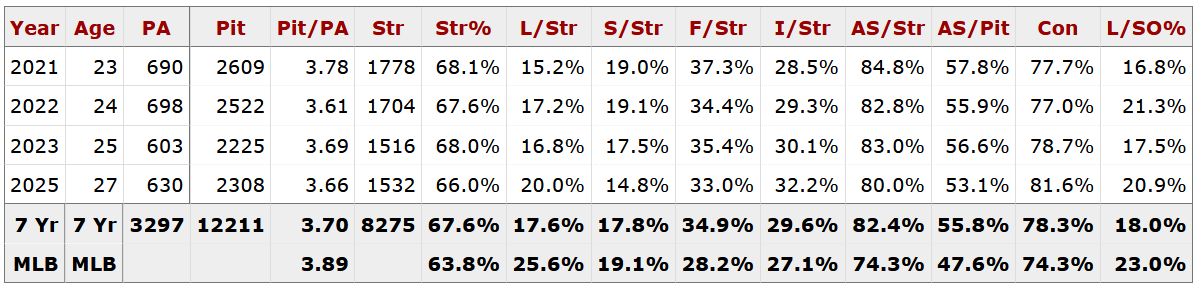
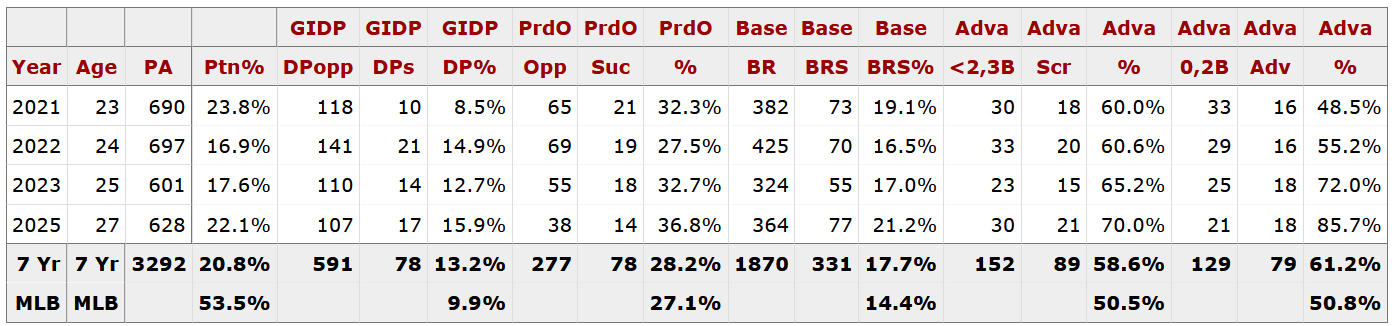
Career pitch summaries and situational batting from Baseball Reference.
Why does Bo put so many balls in play? Well, he swings a lot (reflected by AS/Str and AS/Pit, his % of strikes and pitches swung at), and, more importantly, doesn't miss. His overall percentage of strikes seen is higher than average, but his looking strike rate (L/Str) is much lower, and his swing-and-miss rate (S/Str) is also lower than average, especially in 2025. He does hit a lot of foul balls (F/Str), but you can see that his foul rate has trended downwards while his overall contact rate (Con) has gone up.
Bo does ground into double plays more often than we'd like, but we can live with that. The rest of the situational batting table shows us that he's better than average when it comes to making productive outs (PrdO), advancing runners (Adva), and getting baserunners to score (BRS% and Adva-Scr; not always the same as a recorded RBI). Even though his GIDP% peaked in 2025, so did the rest of these stats!
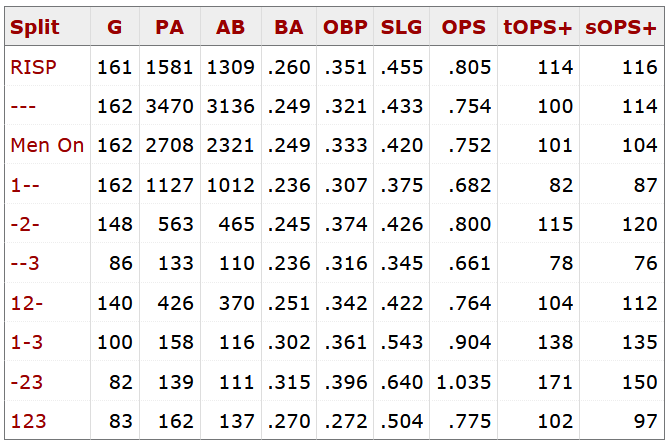
His situational hitting numbers lead us rather nicely into looking at his splits. Consolidated below are his career splits for pitcher handedness (i.e. the platoon split), position in the lineup (5–9 omitted due to small sample sizes), bases-occupied situation, and what Baseball Reference refers to as "clutch" batting.
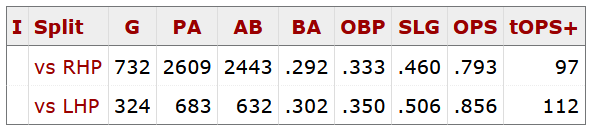
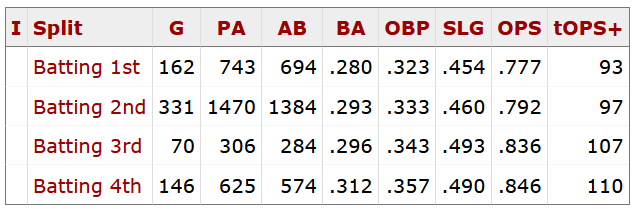
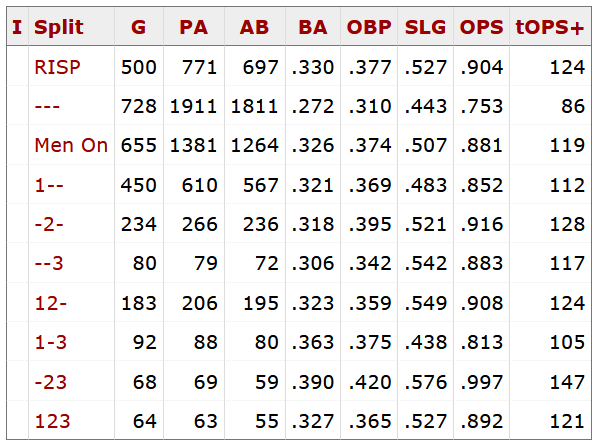
Career platoon, batting order, bases occupied, and clutch hitting splits from Baseball Reference.
Two more quick definitions before looking into what we can learn from these:
- tOPS+: OPS for split relative to Player’s Total OPS. A number greater than 100 indicates this batter did better than usual in this split, and less than 100 means worse than usual.
- Late & Close: "Plate Appearances in the 7th or later with the batting team tied, ahead by one, or the tying run at least on deck."
Splits can give a great bird's-eye view of a hitter's situational strengths and weaknesses. The nice thing about really good hitters like Bo is that they don't have a lot of weaknesses—don't be fooled by a tOPS+ under 100, because a below-average performance for a good hitter might still be really solid offense. The primary info here:
- Bo demonstrates minimal platoon difference, and therefore should really be an everyday hitter and not platooned with another player. (His Ptn% stat from his situational batting above shows that, indeed, he usually hits without the platoon advantage—i.e. he's in the game to face plenty of right-handed pitchers.)
- Bo's slash line (BA/OBP/SLG) gets better further down in the lineup. Now, this could be affected by a variety of factors, but I don't think it's a coincidence, because...
- Bo hits like a truck with RISP. Or really with anyone on base at all! This helps explain his lineup splits, because you're probably going to have more people on base for you as the 3- or 4-spot hitter than if you're batting in the 1- or 2-spot. If he hits better with men on base, he'll likely hit better in lineup positions where there's more men on base ahead of him. Also, just look at the slash lines for the RISP splits—they're downright nasty! This will be extremely relevant information in a little bit.
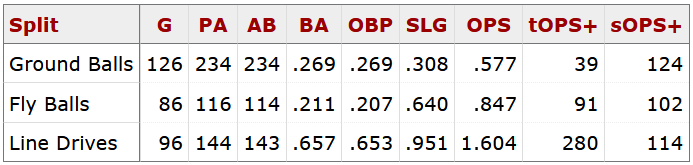
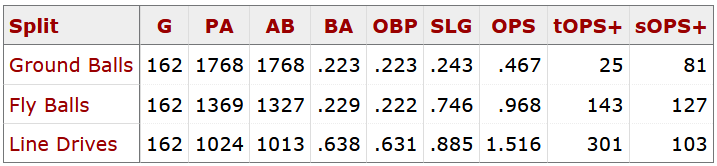
If you followed the 2025 Mets season, you might have been frustrated with how often we grounded out. With that in mind, there's one last set of splits I want to look at here, which are his career hit trajectory splits—i.e. his slash line with ground balls/fly balls/line drives.
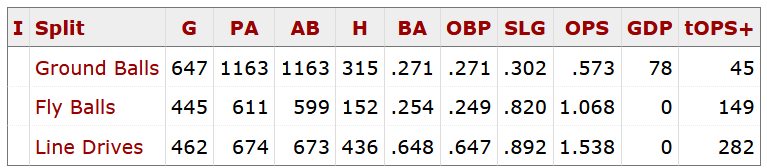
I can hear you saying, "Okay, so his OPS on ground balls is a lot worse than his OPS on other stuff. So what?" Well, let's take a look at the same career splits from some of the 2025 Mets' biggest hitters: Pete Alonso, Francisco Lindor, and Juan Soto.
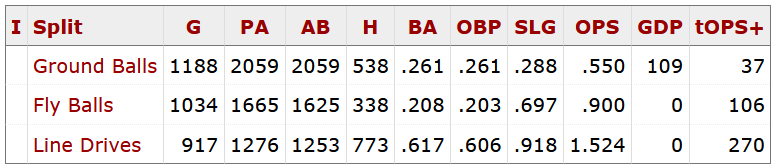
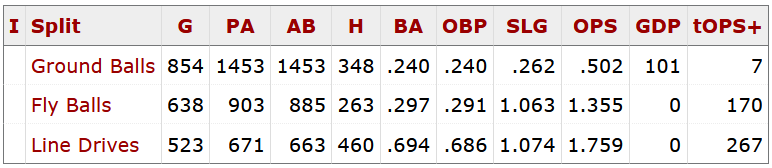
Left to right: career hit trajectory splits for Pete Alonso, Francisco Lindor, and Juan Soto, from Baseball Reference.
Batting .271 on ground balls is a lot better than any of these three players. Bo also slugs .302—which, while low on its own, is also much better than these three. He profiles most similarly to Lindor in his relative differences between GB/FB/LD, but Bo's better pretty much across the board.
If you recall from his hitting profile, Bo hits ground balls 47.5% of the time career-wise. When almost half of your plate appearances result in ground balls, an extra ~50 points of both batting average and slugging—the difference between Bo and Pete—makes a big difference. I speculate that his success is at least partly due to the high hard-hit rate and exit velocities I mentioned earlier; finding gaps is always part of the equation, but I'd imagine that hitting the snot out of the ball generally makes it easier to get past infielders. It's hardly the most important part of someone's hitting profile, but it's interesting to know nevertheless. And hey, while we're talking about Pete...
The Pete (Dis)parity
Alright, this one's on me for getting ragebaited by a Phillies fan account on Twitter. But I love to use other people's terrible arguments as jumping-off points, and when even The WARmonger got involved, I simply couldn't ignore this thread as part of my writeup (you may have already seen the abridged version of my take on Bluesky):
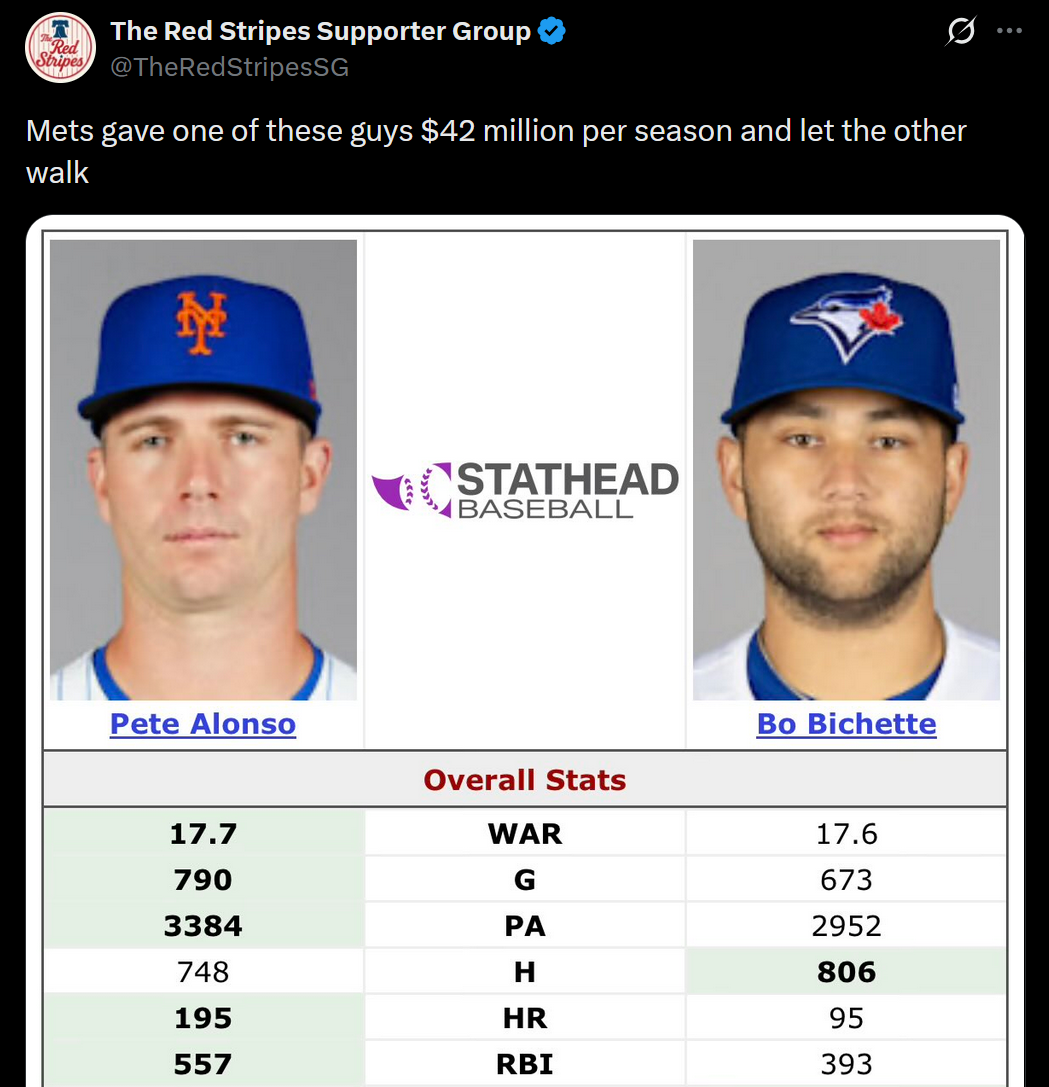
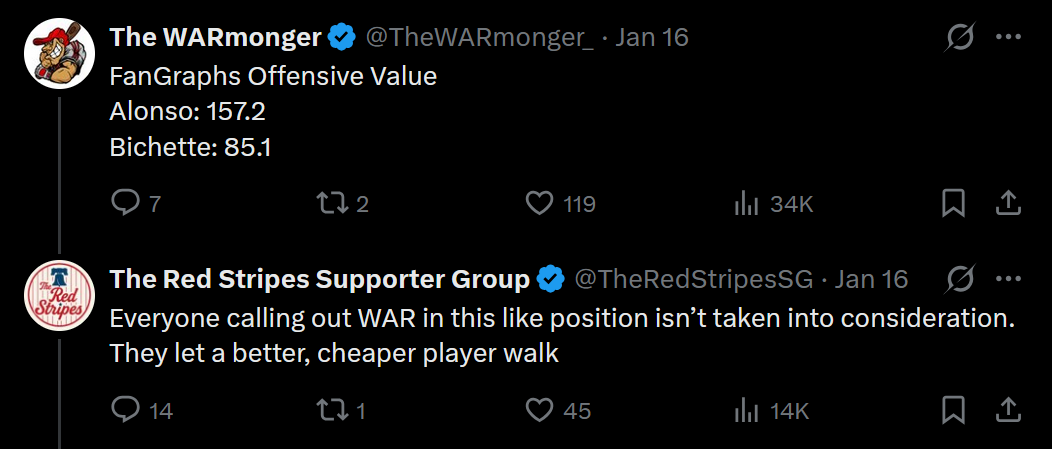
Left: original tweet (image cut off). Right: The WARmonger's reply and OP's followup to it.
We've already established that Bo is a more than competent hitter, so why, indeed, is his FanGraphs Offensive Value so much lower than Pete's? First, let's define the metric in question, in FanGraphs' own words:
Offense (Off) is a statistic that combines a position player’s total context-neutral value at the plate and on the bases. Off is a combination of our park adjusted batting runs above average and our base running runs above average and credits a player for the quality and quantity of their total offensive performance during a given period of time.
You'll notice something very crucial highlighted in that quote: namely, that Off is a cumulative metric, much like WAR (Wins Above Replacement). Therefore, unlike stats like wRC+ (Weighted Runs Created Plus—very similar to OPS+), it depends on playing time. With that in mind, I compiled a side-by-side comparison of Pete and Bo's MLB seasons, starting from 2019—when they both debuted—and including their seasonal games played, plate appearances, wRC+, Offense score, and the difference between their Offense scores.
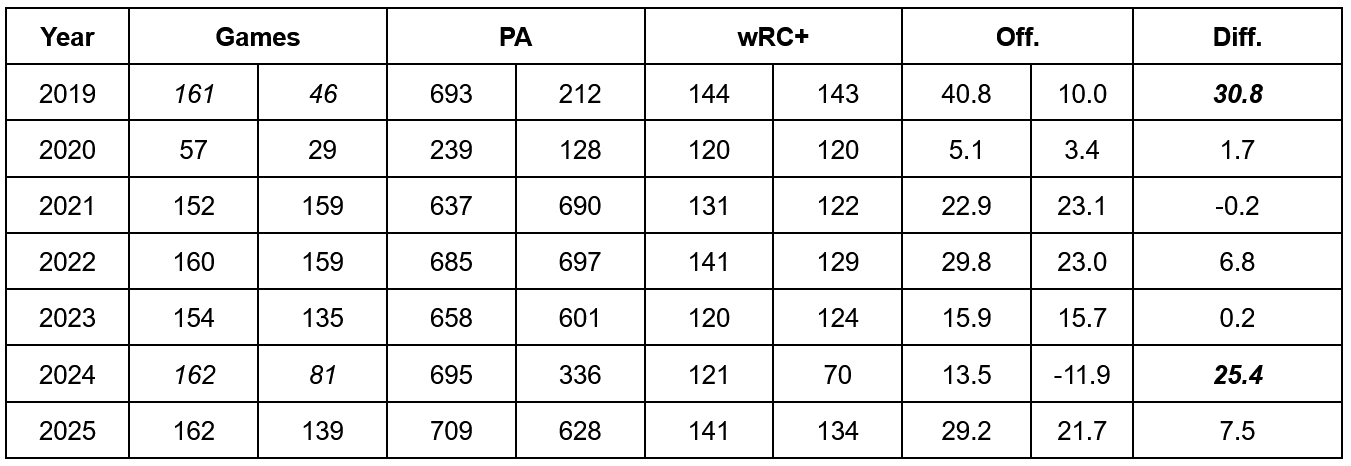
Notice anything interesting? If you thought to yourself, "Hey, it looks like almost all the differential in Offense shows up in two seasons", you'd be right. The difference between their career Offense totals is 72.1 points. 56.2 points, or 77.94% of the differential, comes from the 2019 and 2024 seasons. And what makes those seasons special?
- In 2019, Pete played 161 games as the Opening Day starter for the Mets. Bo played only 46 games for the Blue Jays, because he didn’t debut until July 29th.
- In 2024, Bo played in half as many games as Pete, and as discussed previously, had an uncharacteristically bad season due in part to significant injuries.
When you look more closely at the seasons where they had more comparable playing time, you'll see that Bo is not, in fact, much worse than Pete at all. His wRC+ holds up well outside of 2024, even in smaller sample sizes like 2019 and 2020. Sure, it's still lower, but Twitter statisticians would have you believe that Bo is just flat-out half the player Pete is, and that's blatantly untrue. It's a great reminder to double check when someone posts stats that sound too good to be true, because context is king.
One last note: Pete's career wOBA is .360 (with greater year-to-year variation than Bo), and as mentioned before, Bo's is .346. You can't simply take the average of all of a player's seasons to get career wOBA because of the changing weights, but you can get pretty close; averaging all of Pete's seasons gets you .358, and averaging Bo's gets you .345. If you average all of Bo's seasons except 2024, you get... .358. Just something to think about!
The Mets' Missing Piece
We've looked at Bo's overall stats as well as how he measures up to one of the biggest bats we lost this offseason, but what does that actually mean in terms of where he fits with the Mets? Given the context of his career splits, let's look at his splits from just 2025, relative to the Mets' 2025 team splits.
First, the basic platoon splits:
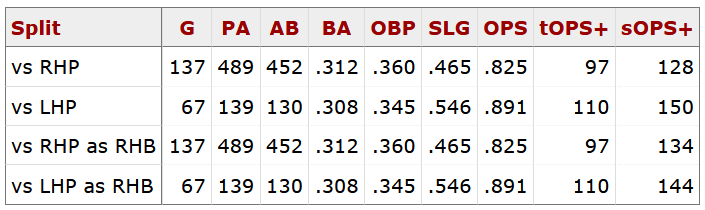
2025 platoon splits for Bo Bichette and the Mets from Baseball Reference.
One more definition before we get too deep is sOPS+:
OPS for split relative to League’s Split OPS.
A number greater than 100 indicates this batter did better than the league in this split. A number less than 100 indicates that the batter did worse than the league in this split.
League averages are for the major leagues as a whole and include pitchers’ batting. sOPS+ is not park-adjusted.
So tOPS+ is relative to the player (or team) themself, and sOPS+ is relative to the league as a whole.
The fact that he hits left-handed pitching well is not groundbreaking information, but you can see that the Mets struggled with it significantly in 2025. Our right-handed batters performed markedly worse than the league average, which is bad! It's always good to shore that up; even if most pitchers are right-handed, you can see that left-handed pitchers still accounted for over one-third of our right-handed batters' plate appearances.
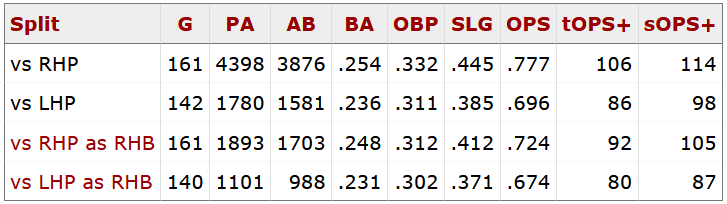
Next, the dreaded bases occupied splits:
2025 bases occupied splits for Bo Bichette and the Mets from Baseball Reference.
These numbers dispel some of the more negative ideas about the Mets' hitting with RISP. We actually performed better than our own average and the league's average. However, Bo is even better than that! The sample sizes are small and therefore not reliable, but we did underperform when it came to having a lone runner on third and when we had the bases loaded. Those situations are especially likely to frustrate fans in the moment, because it feels like a foregone conclusion that you should get someone home. While Bo's sample sizes for those specific circumstances are particularly small, his overall numbers in all RISP situations across his career are excellent, as we've already established. Better hitting with RISP is, well, better.
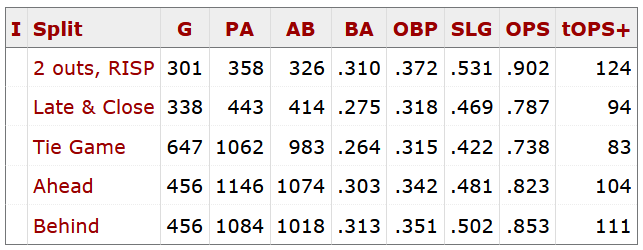
And finally, the infamous clutch stats:
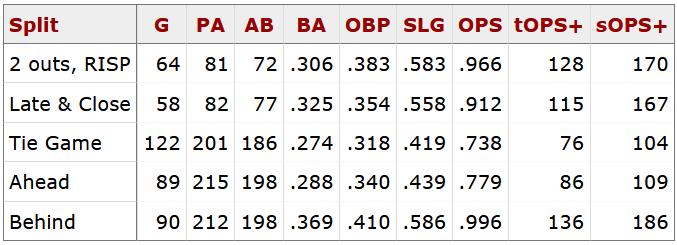
2025 clutch hitting splits for Bo Bichette and the Mets from Baseball Reference.
Before my father says anything about how "clutch hitting" isn't real, I'd like to state that I'm not taking a position on whether or not "clutch hitting" is a "real" skill (though The Book suggests it might be). I do, however, find these numbers useful in illustrating the fans' emotional eye test: it felt like the Mets didn't pull it out of the bag when they needed to most, and indeed, you can see that they collectively hit worse when behind and in "late & close" situations. That underscores the fact that the Mets were the only team in 2025 to never win when trailing after the 8th inning. Up in Toronto, Bo was doing the exact opposite: he played better in those exact same situations (sample size notwithstanding). Not to mention that the Mets hit the same as usual with 2 outs and RISP, but Bo hit a lot better than his average, which holds up when looking at his full career splits.
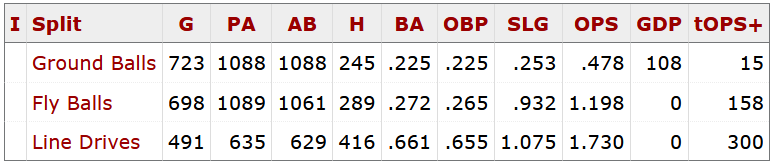
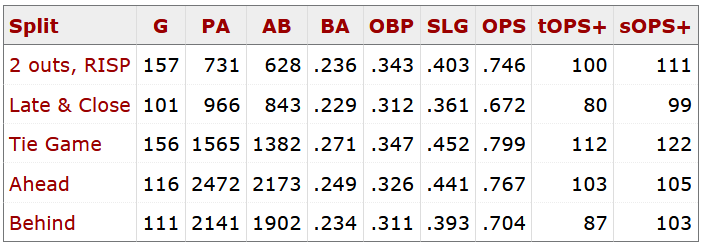
Just for fun, here's the hit trajectory splits, so we can see just how dire the Mets' ground ball hitting was:
2025 hit trajectory splits for Bo Bichette and the Mets from Baseball Reference.
It shouldn't be controversial to say that the 2025 Mets were pretty bad at turning ground balls into anything productive, and man, they hit a lot of them. But Bo was much better than the average hitter!
Look, I'm not saying that Bo is the solution to all of our problems. But it's been over ten years since the Mets had a player (not named Jeff McNeil) who consistently hit over .290 in multiple full seasons:
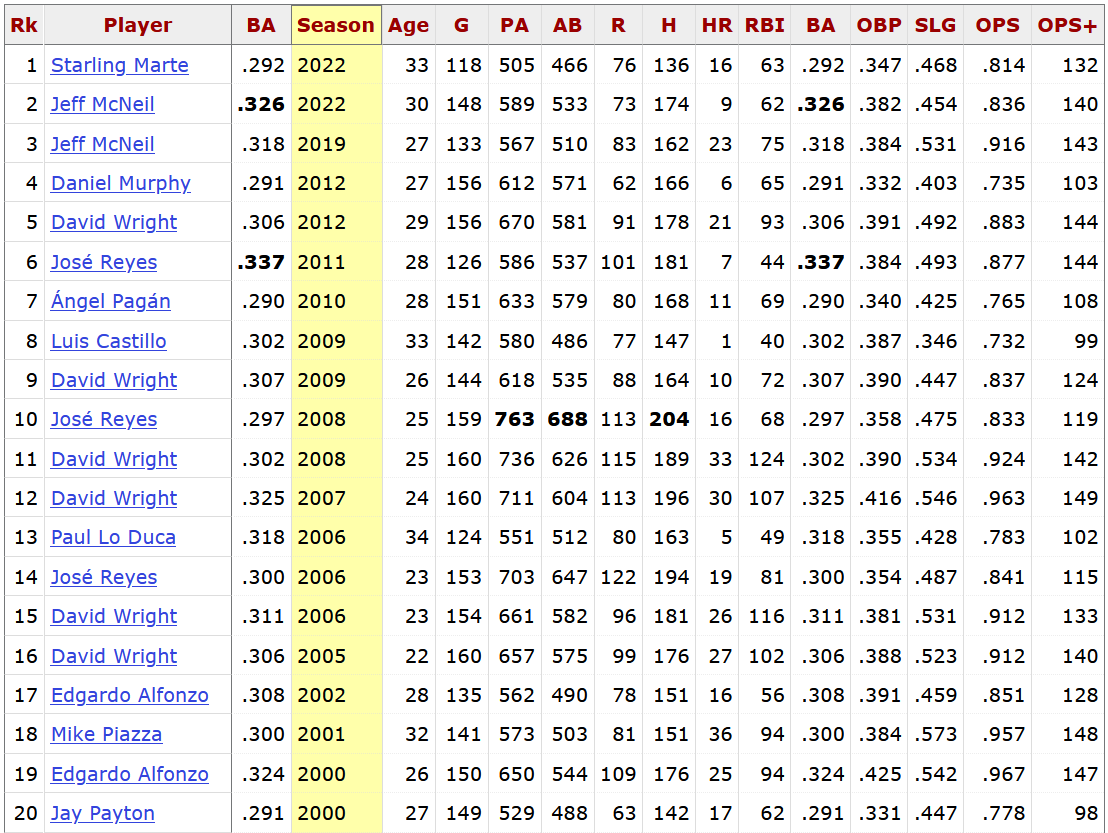
Here's where my defense of the batting average comes in. Bo Bichette gets on base at a perfectly respectable clip, posting a nice .357 OBP in 2025. But keep in mind that he was batting .311, so the vast majority of that OBP came from hits. Compare this to, say, Juan Soto's 2021 season, where he batted .313 and had an OBP of .465, because as we all know:
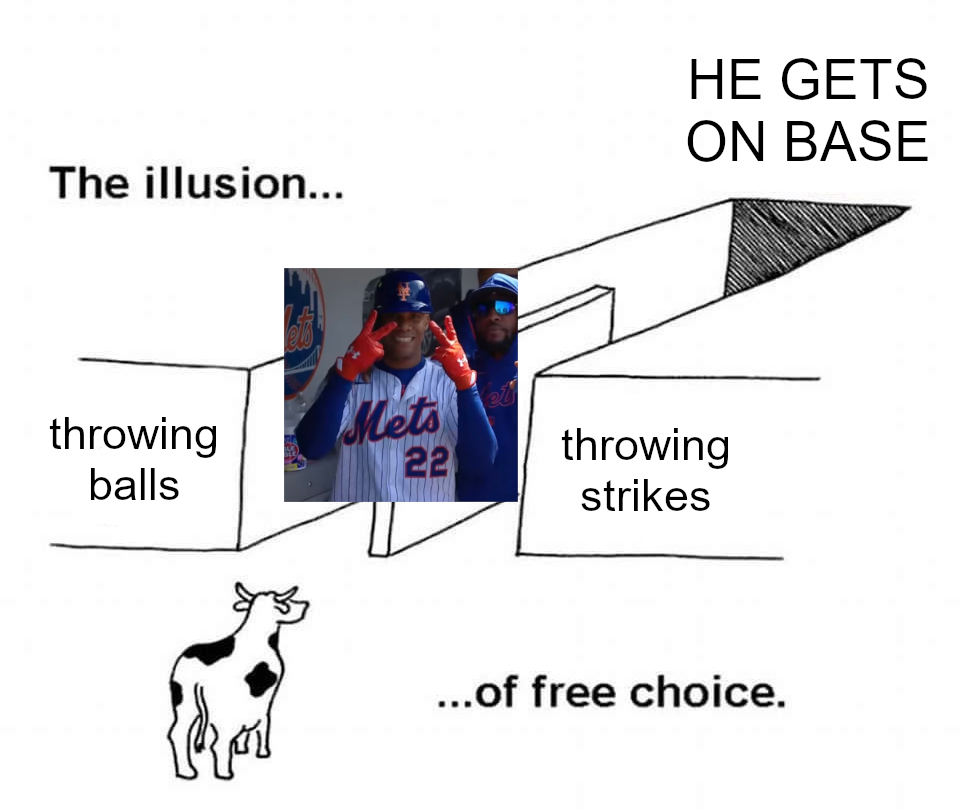
Juan Soto gets on base, and he does it by walking a lot; in that 2021 season, he had a staggering 22.2% walk rate. Bo, as we have established, does not walk a lot.
When asked about potential lineups for the coming season, Mets manager Carlos Mendoza has primarily advanced a projection of Lindor-Soto-Bichette at the top of the order, but also suggested that Bo could hit ahead of one or both of them. I will tell you in no uncertain terms right now: if I have to watch Bo Bichette bat leadoff even once, I will lose what little is left of my precious, expensive, and very fragile marbles.
Let me explain why. If I have a good player who primarily gets on base by hitting a lot, and not by walking much, I want to put him in situations where there are people on base ahead of him. Why? Because it's a hell of a lot easier to bat in a run than walk one in. It's called Runs Batted In for a reason. (Yeah, yeah, walking in a run counts as an RBI, but that's not the point.)
To illustrate the concept, I categorized players from 2025 league-wide by their lineup spot and sorted them by batting average, looking at the stats of the top ten players. I set a minimum of 400 PA in order to identify players who got the majority of their playing time in that lineup spot, as well as to get a reasonable sample size for their stats. I chose to sort by BA because Bo's hitting profile really highlights his high batting average, and I wanted to compare him to similar players in addition to limiting how much of an outlier he is. This really isn't rigorous statistical analysis by any means, but rather a quick-and-dirty way to visualize his profile relative to other players around the league in the lineup spots we're discussing.
Here are the top ten players by batting average in the leadoff spot and 2-spot:
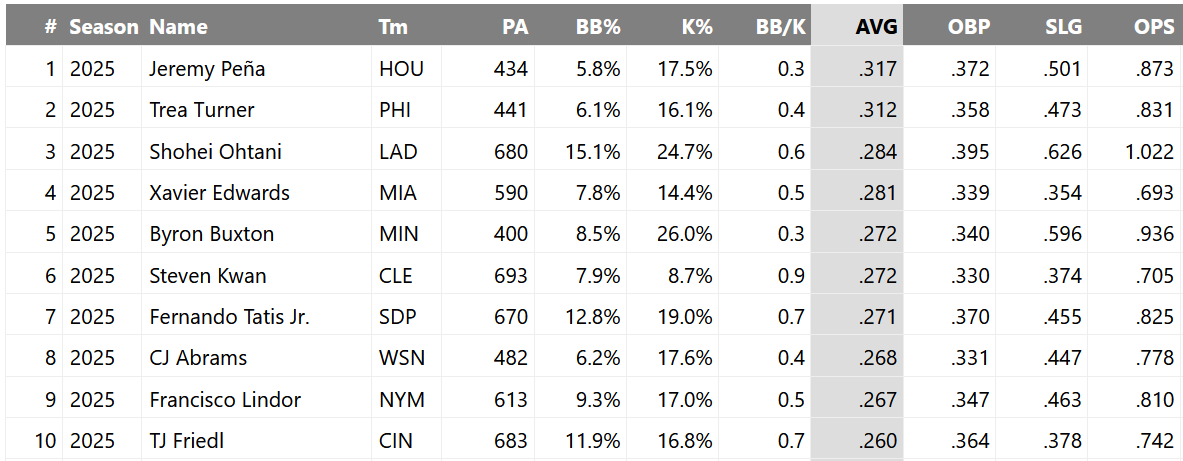
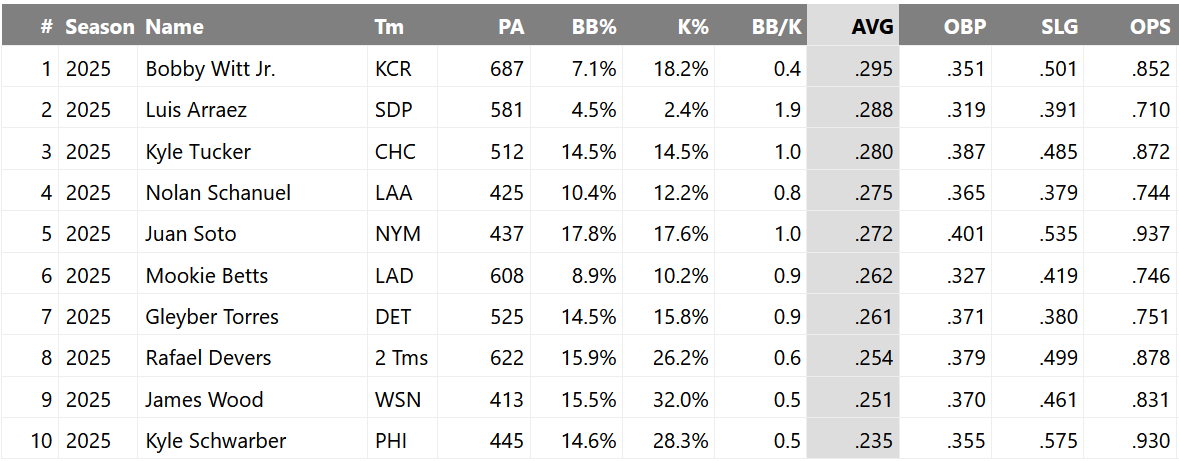
Top 10 hitters sorted by batting average in the first lineup spot (left) and second lineup spot (right) from FanGraphs.
And then the 3- and 4-spot hitters (includes both positions):
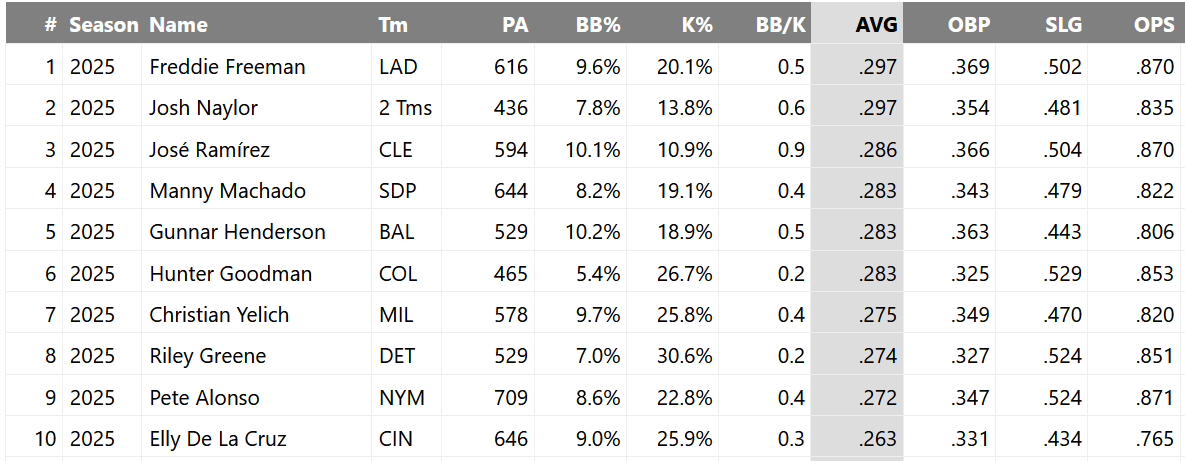
I very simplistically averaged most of these stats together to get a crude picture of the "typical" high-BA hitter in each category (though you'll note there are some major outliers in each one). Here's what those numbers look like compared to Bo's 2025 season:
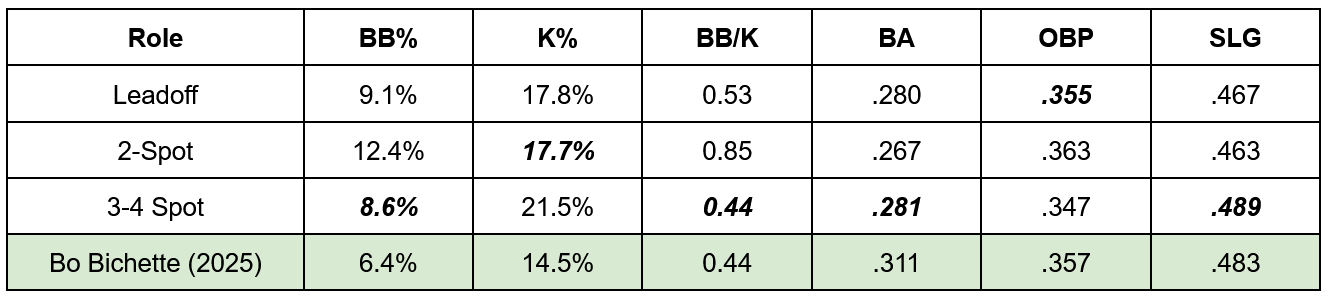
The conclusion one might draw from this is that Bo best fits the profile of a 3- or 4-spot hitter (i.e. cleanup or adjacent) better than he fits the 1- or 2-spot. It was a couple thousand words ago, but if you'll recall his batting order splits, he's spent about 44% of his career games in the 2-spot, and another 22% hitting leadoff. That's 66% of his career games spent in lineup positions where he not only fits suboptimally, but also hits worse! The 2-spot is a particularly bad match due to his low walk rate, low OBP (relative to the slot), and high BA—especially when you consider that his walk rate has historically been even lower. Again, this rough comparison isn't a statistically sound explanation on its own, but rather a reflection of the underlying mathematical principles that make teams arrange their lineups in a certain way.
The run environment has changed since the days of The Book, but many of its conclusions are still reflected in contemporary team management. In this case: a single and a walk are worth the exact same amount, in terms of run value, with no outs and the bases empty. But the moment that someone gets on base, the single becomes much, much more valuable. This is why the 1- and 2-spots generally feature hitters who not only get on base a lot, but do so by walking.
Remember what we said about how good Bo is with RISP? Right. His batting average becomes significantly more valuable when there are runners that can advance on a hit—especially when you consider that his home run rate has hovered around league average, even though his extra base hit rate (XBH/PA) is meaningfully above average. If nobody's on base ahead of you, the only way you can drive in a run is by knocking one out of the park. If you don't do that often, but hit plenty of singles or doubles instead (as Bo does), you're much better suited to hitting behind someone who gets on base frequently.
Additionally, The Book highlights that good baserunners and stealers are best utilized in front of contact hitters who don't strike out much. Given that Francisco Lindor has graded as an excellent baserunner and stealer for years, and that Juan Soto woke up one day in 2025 and decided to become Rickey Henderson, I feel pretty confident in stating that Bo Bichette's ideal position in the lineup is behind them, not in front of them—especially because he's not a particularly good runner or stealer himself!
Now, there's plenty of arguments to be had over whether he should bat 3rd or 4th in the lineup, but different rosters call for different approaches, which is why I opted to combine the 3- and 4-spot hitters above. Pete, for example, split his time almost perfectly between those two spots this past year, and was the Mets' most-used player in both. I'm inclined towards Bo batting in the 3-spot (as in Mendoza's primary lineup) for the reasons listed above, namely so he can hit directly behind Soto; this is likely also the best way to alternate handedness in the lineup.
And really, if I were pitching with Juan Soto at the plate and a guy who hits like this on deck, I would probably start idly contemplating my career choices and whether I could comfortably retire on the contents of my bank account. Fortunately for everyone involved, I'm not a major league pitcher.
Don't get me wrong: I'm not here to tell you that Luis Arráez is secretly the most valuable hitter in baseball, or that Bo Bichette's batting average is the only component of his offense that matters. My goal is, first and foremost, to give you a better understanding of his entire hitting profile; it's also to explain why that hitting profile is still extremely valuable without being home-run heavy, and his high average is only one of several reasons for that.
Crucially, like any other player, his offensive value must also be evaluated in the context of his defensive position and the contract he signed. While I don't have quite as much to talk about when it comes to those things—in large part because I simply don't understand them as well as I do his bat—it's definitely enough to spare you another few thousand words of reading here, so my analysis of those will follow in a separate post. I hope that you found this valuable in learning about one of our newest Mets, and that you, like me, are excited to see how potent he can be in our lineup—assuming that we don't have to watch him hit leadoff.